In the current climate of link building and digital PR, there’s one thing that’s nearly as important as the story you’re telling, and that’s data.
When we think about how journalists and writers work in the industry today, they are squeezed tighter than ever. With a huge amount of redundancies from some major publications such as Buzzfeed, HuffPost and Elle in 2019, journalists are being assigned more and more publications, assignments and niches, and are therefore responsible for writing even more articles per day.
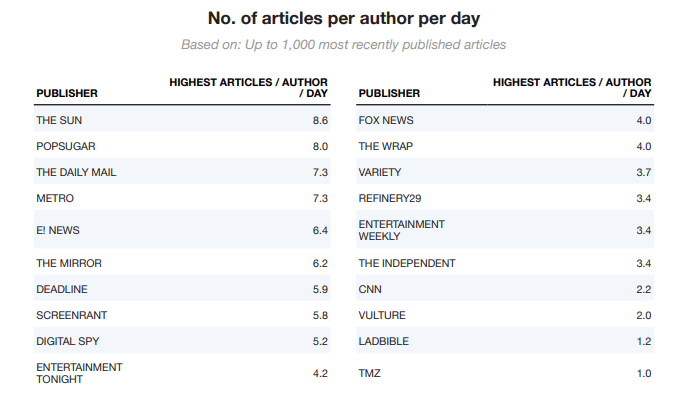
According to BuzzStream’s latest research, journalists are often writing around one article per hour, and up to nine articles per day, with some extreme cases of 17 articles per day in the personal finance industry. Here are the stats from the ‘entertainment’ sector.
As PRs, this is putting us in a slightly different position. While there has been plenty of discussion around our jobs getting harder, the squeeze on journalists should make our lives easier, especially if we are doing our jobs correctly. Speaking very generally, journalists simply don’t have time to do in-depth research for an article or conduct primary data on a topic — but we do.
At AGY47, we have recently concluded that surveys aren’t for us. We have used them in the past with varying results, but find that it’s very difficult to capture data from audiences that represent either the population as a whole, or the demographics of some of our clients.
Plus, we have had better results with data that we’ve manipulated or found ourselves. When you consider the time and cost of conducting a survey, it’s not worth the investment in most cases.
To secure coverage for clients using data, and to create excellent contacts and relationships with journalists and writers in the future, here are some solutions that you may not have come across already.
Trends and popularity
Using trends and popularity data takes us to the trendy tactic of newsjacking for PR. By using tools like Google Trends, which shows search popularity for a certain term at a certain time, and Exploding Topics, a tool that shows you upcoming trends, you can create stories.
For example, you can find out when something was most or least popular, and discover what the public are curious about, or tired of.
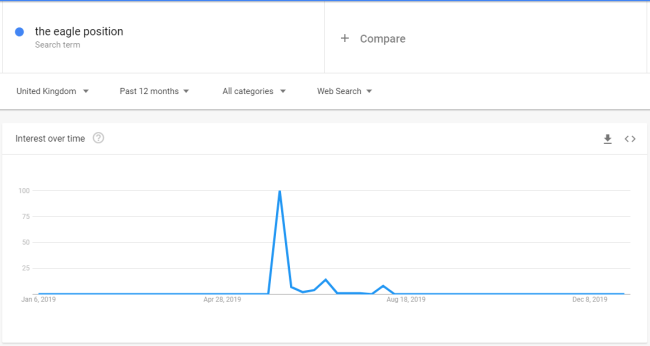
During the 2019 series of Love Island in the UK, Twitter exploded with confusion after finding out Curtis’ favourite position in the bedroom, ‘the eagle’. We can use Google Trends to discover that it sparked curiosity in the British public on that day of broadcast, and also the following Sunday. This makes for a very quick tongue-in-cheek story that’s shareable and appealing to journalists.
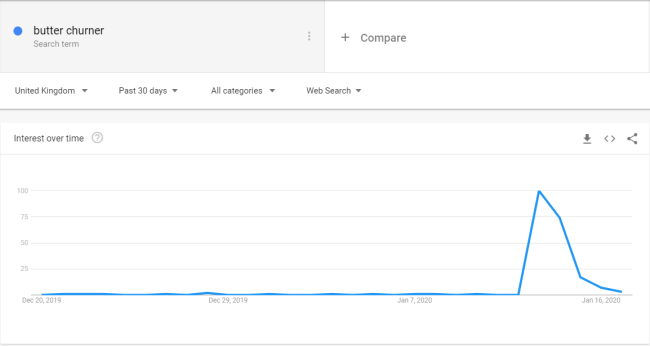
This year, it was all about the butter churner, which we can see reached its peak on the day of broadcast of the episode.
A story, which would potentially take less than an hour or so to put together, would appeal to the mass media, as they will all be writing about it. You’re just providing the data.
Open data sets/ Public service data
There is a wealth of public data readily available for use in campaigns. The Office for National Statistics as well as Statista, and Google have a wealth of publicly available data.
Some less popular but incredible sources of data are the likes of Google Finance, which allows you to see stock values for many companies. In the US, there’s Census.gov and USAGov offering data on the nation’s people and economy. In the UK, data.gov.uk and police.gov.uk have a wealth of information on local authorities, public bodies, crime rates and stop and search information.
Freedom of Information Requests are a time consuming but worthwhile way of getting primary data on a topic. You can submit very specific questions on a topic to councils, schools, colleges and universities, health trusts, hospitals, publicly owned companies, museums and the police.
Along with the obvious ones, there are other public bodies in the UK, such as The Environment Agency, The Industrial Injuries Advisory Council, The Zoos Forum, and for very niche requests for data, The Human Tissue Authority.
Social media stats and tools
Journalists love to write stories about things that are ‘most liked’ and hated, but there’s a way to go one step further. Using Python, a programming language that is harnessed by many SEOs, you can scrape both the number of Tweets and the sentiment of these tweets around a certain topic. This helps you gauge the public’s perception of events, people, TV shows — almost anything! Here’s a tutorial on the basics of sentiment analysis using Python.
Scraping sites
You can also scrape popular websites for data to turn into a story. For example you could scrape a popular review site to see the public’s favourite (or least favourite) film, song, dish, actor or artist over a certain period of time.
Turn that idea around to find the volume of reviews, and create stories about future favourites, such as ‘upcoming’ holiday destinations. You could analyse hundreds of results and see which have the most dramatically and strongly opposing reviews, i.e. ‘The song that divided the nation’.
Manipulating existing data
In the past, I’ve seen success from brands taking existing data, whether it’s their data or already out there online, using it in a story and getting great coverage. I don’t see anything wrong with this at all, as long as the original source is credited.
To make the findings more original, there are ways to manipulate existing data. For example, take the average time Brits take to commute to work per region, and the national average wage.
You then have a story that can go regionally and nationally about how much extra we could earn if we were paid for our commutes. A story that is sure to create a reaction, especially for anyone reading the article on their way into the office!
I saw an example recently where it was proven with data that Americans’ musical tastes mirror their political divides.
Throw the research out of the window – create your own data!
I’m seeing more and more great campaigns where agencies are really going all-in and conducting their own experiments and using that data.
Things like collecting germ swabs on tube lines to see which is the most germ-filled, and doing primary research on how easy it is to buy an individual’s online data.
Each of the above methods are a great way to diversify your ways of getting data to turn into stories that journalists will love.
If you are using interesting and new data to produce content that stands out and it still relates to your brand, that’s a winning combination and you’re likely to have success with your story.


 Check out the BuzzStream Podcast

